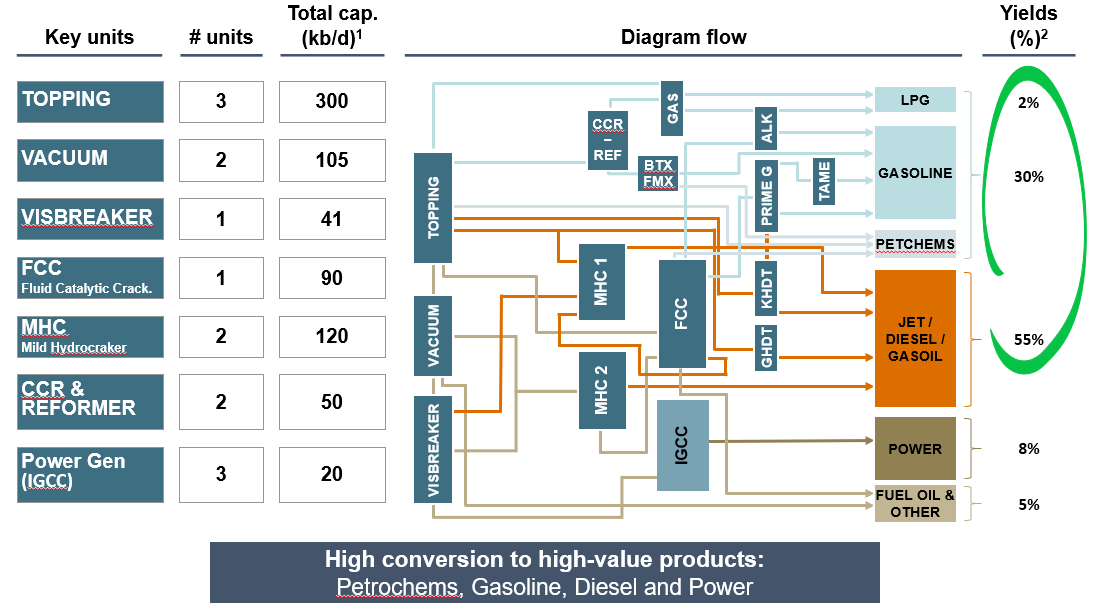
The Group carries out its oil refining activities at the Sarroch industrial site, managed by the subsidiary Sarlux and located on the south-western coast of Sardinia. The processing capacity of 15 million tonnes per year (300,000 barrels per day) accounts for about 20% of the Italian refining capacity.
Our refinery is one of the largest in Europe and one of the most advanced in terms of plant complexity.
These characteristics are the result of decades of investments aimed at increasing capacity and efficiency, combined with an attention for safety and respect for the environment.
In 2015, Sarlux acquired the adjacent petrochemical facilities owned by Versalis (ENI Group), thus expanding its range of products to include certain categories of aromatics and intermediates in the petrochemical supply chain.
The main points of strength of the Sarroch site
Largest single-site in the Mediterranean.
300 thousand barrels/day of refining capacity.
Top-tier Med site in term of complexity and size.
About 85% of light and middle distillates.
Nelson’s complexity index equal to 11.7.
Fully integrated IGCC power generation plant (heavy residue converted into electricity, hydrogen and steam).
Integrated petrochemical plants.
Supply from >30 countries worldwide
of crude oils which belong to a wide range of grades
13 berths for cargo ships.
>4 million cubic metres of storage.
Strategic location in the centre of the Mediterranean.
Visit Sarlux's website - www.sarlux.it
Structure of the refinery

1. Calculated using calendar days
2. Yields are calculated net of "C&L" - values refer to Fy 2018
| Process Unit | Nr. of units | Cacity (barrels per calendar day) | Nelson Complexity Factor* |
| Atmospheric Distillation | 3 | 300,000 | 1.0 |
| Vacuum Distillation | 2 | 105,000 | 1.3 |
| Visebraking | 1 | 41,000 | 2.75 |
| Distillate Catalytic Cracking FCC | 1 | 90,000 | 6.0 |
| Catalytic Reforming CCR | 1 | 29,000 | 5.0 |
| Semi-Regenerative Reforming | 1 | 20,000 | 5.0 |
| Distillate Hydrocracking | 1 | 120,000 | 8.0 |
| Desulphurization Naphtha & Gasoline | 2 | 73,000 | 2.5 |
| Desulphurization Distillate & Diesel | 3 | 78,000 | 2.5 |
| Alkylation | 4 | 9,000 | 10.0 |
| Oxygenates TAME | 6,000 | 10.0 | |
| Refinery Sulphur Units (tons/day) | 1 | 620 | 240.0 |
| Hydrogen/PSA (kcfd) | 3 | 49,985 | 1.0 |
| BTX | 2 | 5,300 | 20.0 |
| Total Refining Complexity & Pet Chem | 10.4 | ||
| Power Generation (MW) | 3 | 575 | - |
| Residue Gasification IGCC | 3 | 21,000 | 12.0 |
| Sulphur Units IGCC (tons/day) | 2 | 350 | 240.0 |
| Hydrogen Unit IGCC (kcfd) | 2 | 46,596 | 1.0 |
| Total Sarroch Site Complexity | 11.7 |
* Source: Woodmackenzie 2018 Global Refinery Map, September 2018
Logistics
The logistics facilities include over 4.3 million cubic metres of storage tanks.
Raw materials processed
The geographical position in the middle of the Med has strategic importance, as it gives easy access to the sources of crude oil and to the markets of destination of finished products.
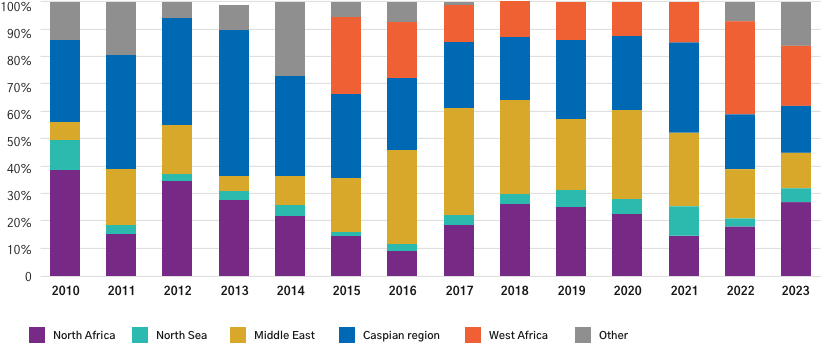
RAW MATERIALS BY ORIGIN

One of the main strengths of the Sarroch refinery is its great flexibility and ability to use different types of crude oil, including non-conventional ones, exploiting market opportunities and differentials in price thanks to its commercial and trading skills.
RAW MATERIALS BY TYPE
| 2023 | ||
|---|---|---|
| Light extra sweet | 47% | |
| Light sweet | 10% | |
| Medium sweet/extra sweet | 1% | |
| Medium sour | 1% | |
| Heavy sour/sweet | 40% | |
| Densità media del grezzo | °API | 33.3% |
Products
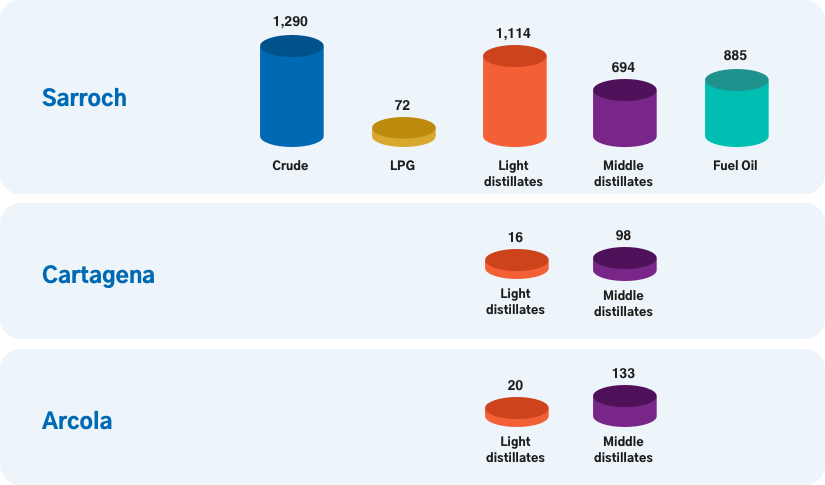
As regards the refined products yield, in 2023, consistently with the production set-ups characterized by the shutdowns of some plants, the percentage yields in middle distillates decreased in favor of higher production of semi-finished products, fuel oil and naphtha.
